


Top 10 SRE Tools for Beginners: What to Learn First
Top 10 SRE tools for freshers: Linux, Git, Docker, Kubernetes, Prometheus, Grafana, Loki, OpenTelemetry, Terraform and PagerDuty, with first exercises.
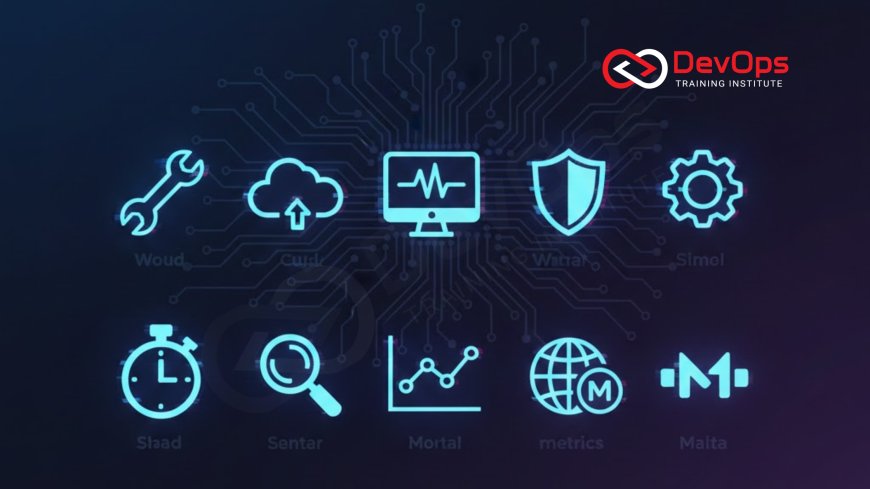
If you are new to site reliability engineering, learn these ten tools in roughly this order: Linux and the shell, Git, Docker, Kubernetes, Prometheus, Grafana, a logging stack (Loki or Elasticsearch), OpenTelemetry, Terraform and an on-call tool such as PagerDuty. Together they cover running systems, measuring them and responding when they break.
This guide is for freshers and career switchers. It explains the basic SRE terms first, then each tool in plain language: what it is, why an SRE uses it and a first exercise to try. If you already know the basics and want the automation layer (chaos testing, runbook automation, auto-remediation), read our main guide to SRE automation tools for reliability engineering. For the role itself, start with what SREs do in DevOps teams.
Key takeaways
- SRE is about keeping a service reliable enough for its users, measured with SLIs and SLOs. Tools support that goal; they are not the goal.
- Linux, Git and one programming or scripting language come before any SRE-specific tool.
- Prometheus and Grafana are the most common open source way to learn metrics and alerting.
- Kubernetes knowledge is expected in most SRE job descriptions, but learn Docker first.
- Every tool here has a free, open source version or a free tier you can practise with on a laptop.
- Build one small project that uses all ten tools together. It teaches more than ten separate tutorials.
SRE basics in five definitions
You will see these words in every SRE tool's documentation, so learn them first. They come from Google's Site Reliability Engineering books, which are free to read online.
| Term | Meaning | Example |
|---|---|---|
| SLI (service level indicator) | A measurement of service behaviour that users care about | Percentage of HTTP requests that return successfully in under 300 ms |
| SLO (service level objective) | The target for an SLI over a time window | 99.9% of requests succeed over 30 days |
| SLA (service level agreement) | A contract with customers, often with penalties | Credits if monthly availability drops below 99.5% |
| Error budget | The amount of failure the SLO allows | 99.9% over 30 days allows about 43 minutes of failure |
| Toil | Manual, repetitive operational work that scales with load | Restarting the same service by hand every week |
The error budget is the idea that makes SRE different from traditional operations. If the service is well within its SLO, the team can ship faster. If the budget is spent, reliability work takes priority. Tools measure the SLI, alert when the budget burns too fast and help you remove toil.
The 10 tools at a glance
| # | Tool | Category | Why a fresher should learn it |
|---|---|---|---|
| 1 | Linux and shell | Foundation | Every server and container you debug runs Linux |
| 2 | Git | Foundation | All code, config and runbooks live in Git |
| 3 | Docker | Containers | Packages apps the way production runs them |
| 4 | Kubernetes | Orchestration | Runs most modern production services |
| 5 | Prometheus | Metrics and alerting | Measures SLIs and fires alerts |
| 6 | Grafana | Dashboards | Shows SLOs and system health visually |
| 7 | Loki or Elasticsearch | Logs | Answers "what happened?" during an incident |
| 8 | OpenTelemetry | Instrumentation and traces | Vendor-neutral standard for collecting telemetry |
| 9 | Terraform | Infrastructure as code | Creates repeatable infrastructure from code |
| 10 | PagerDuty (or similar) | On-call | How alerts reach a human |
Foundations
1. Linux and the shell
Most SRE debugging is still done in a terminal. You need to read logs, check processes, inspect network connections and understand file permissions. Start with commands such as ps, top, df -h, free -m, ss -tulpn, journalctl -u, systemctl status, curl -v and grep. Then learn to write small Bash scripts and pick up Python or Go for anything longer.
First exercise: install a web server on a Linux VM, stop it, and use systemctl, journalctl and ss to find out why the site is down.
2. Git
SRE teams keep application code, infrastructure code, alert rules, dashboards and runbooks in Git. Changes go through pull requests, so they are reviewed and can be rolled back. Learn clone, branch, commit, rebase, revert and how to read git log to find which change broke something.
First exercise: put your scripts from step 1 in a repository, make a bad change, then find and revert it with git log and git revert.
Running services
3. Docker
Docker packages an application and its dependencies into an image that runs the same on a laptop and a server. SREs read Dockerfiles to understand what is actually deployed, check container logs and resource limits, and build small images that start fast. Our guide to the benefits of Docker in DevOps covers why it is so widely used.
docker run -d --name web -p 8080:80 nginx:stable
docker logs web
docker stats --no-stream
docker exec -it web sh
First exercise: containerise a small Python or Node app, then limit its memory with --memory and watch what happens when it exceeds the limit.
4. Kubernetes
Kubernetes schedules containers across machines, restarts failed ones and rolls out new versions. SREs work with Deployments, Services, probes, resource requests and limits, and HorizontalPodAutoscalers. Most incidents you will see as a junior involve a pod that will not start, fails its readiness probe or runs out of memory.
kubectl get pods -A
kubectl describe pod <pod-name> -n <namespace>
kubectl logs <pod-name> -n <namespace> --previous
kubectl rollout undo deployment/<name> -n <namespace>
First exercise: run kind or minikube on your laptop, deploy your container, break its readiness probe and practise finding the cause. Read the Kubernetes architecture components to understand what each part does.
Measuring reliability
5. Prometheus
Prometheus is a CNCF graduated monitoring system. It scrapes metrics from your services over HTTP, stores them as time series and evaluates alert rules written in PromQL. It is where most freshers first turn an SLO into numbers.
groups:
  - name: availability
    rules:
      - alert: HighErrorRate
        expr: |
          sum(rate(http_requests_total{status=~"5.."}[5m]))
            / sum(rate(http_requests_total[5m])) > 0.01
        for: 10m
        labels:
          severity: page
        annotations:
          summary: "More than 1% of requests are failing"
First exercise: expose a /metrics endpoint from your app with a Prometheus client library and write the alert above.
6. Grafana
Grafana builds dashboards from Prometheus, Loki, Elasticsearch, cloud monitoring services and many other data sources. A good beginner dashboard shows the four golden signals from the Google SRE book: latency, traffic, errors and saturation. See how Prometheus and Grafana work together for a setup walkthrough.
First exercise: build a dashboard with one panel for each golden signal for your app.
7. Loki or Elasticsearch (logs)
Metrics tell you something is wrong; logs often tell you why. Grafana Loki indexes only labels and stores log lines cheaply, and you query it with LogQL from Grafana. Elasticsearch (with Logstash or Beats and Kibana, the ELK or Elastic Stack) indexes full text and is common in larger companies. Learn one of them well; the ideas transfer.
First exercise: ship your app's logs to Loki with Grafana Alloy, which replaces Promtail, then search for the error behind an alert.
8. OpenTelemetry
OpenTelemetry is a CNCF project that defines APIs, SDKs and a Collector for traces, metrics and logs. You instrument code once and send data to any compatible backend (Jaeger, Grafana Tempo, Prometheus, or a commercial tool). Traces show how one request moved through several services, which is how you find which hop was slow.
First exercise: add OpenTelemetry auto-instrumentation to two small services that call each other, send traces to Jaeger, and find the slow call. For the bigger picture, read observability vs traditional monitoring.
Changing and responding
9. Terraform
Terraform creates cloud and on-premises infrastructure from code. SREs use it so environments can be rebuilt, reviewed and compared. Learn the init, plan, apply cycle, state, variables and modules. OpenTofu, the Linux Foundation fork, uses the same language if your employer has moved to it.
terraform init
terraform plan -out tfplan
terraform apply tfplan
First exercise: use Terraform to create a small VM or a Docker container with the Docker provider, then destroy and recreate it.
10. PagerDuty or another on-call tool
An alert is only useful if the right person sees it. On-call tools manage schedules, send phone, SMS and app notifications, and escalate if nobody responds. PagerDuty is the most widely known; alternatives include Jira Service Management, incident.io, Rootly, Grafana Cloud IRM and Datadog On-Call. Our on-call management tools comparison explains the differences.
First exercise: route your Prometheus alert through Alertmanager to a free on-call tier or a chat webhook, and write a one-page runbook for it.
A suggested learning order
- Weeks 1 to 4: Linux, shell scripting, Git and basic networking (DNS, HTTP, TCP).
- Weeks 5 to 8: Docker, then Kubernetes on a local cluster.
- Weeks 9 to 12: Prometheus, Grafana and one logging stack, with SLOs for your own app.
- Weeks 13 to 16: OpenTelemetry tracing, Terraform, alert routing and runbooks.
The timing is a guide for someone studying part time; go faster or slower as you need. What matters is that you finish with one project where an app runs on Kubernetes, has an SLO dashboard, fires an alert when you break it and has a runbook that explains the fix.
Mistakes beginners make
- Collecting tools instead of skills. Knowing how to read a stack trace and a latency graph matters more than knowing ten dashboards.
- Alerting on everything. Start with one alert tied to user experience.
- Skipping networking. Many outages are DNS, TLS or load balancer problems.
- Learning Kubernetes before Linux and Docker. You will not understand why a pod fails.
Train with us
Our DevOps training covers Linux, Git, Docker, Kubernetes, Terraform and CI/CD, and the Prometheus and Grafana course covers metrics, dashboards and alerting. Classes run in Kharadi, Pune and live online. When you are ready for interviews, practise with our SRE interview questions.
FAQ
Which SRE tool should a fresher learn first?
Start with Linux and Git, then Docker. They are the base for every other tool. After that, learn Kubernetes and Prometheus with Grafana.
Do I need to know programming for SRE?
Yes. You need at least shell scripting and one language such as Python or Go to automate toil, write tools and read application code during incidents.
What is the difference between SLI, SLO and SLA?
An SLI is a measurement, such as successful request rate. An SLO is the internal target for it, such as 99.9% over 30 days. An SLA is a contract with customers that usually has penalties.
Is Kubernetes required for SRE jobs?
Most SRE job descriptions list Kubernetes, but not all. Learn it after Linux and Docker, because many production services run on it.
Can I learn SRE tools for free?
Yes. Linux, Git, Docker Engine, Kubernetes (via kind or minikube), Prometheus, Grafana, Loki, OpenTelemetry and Terraform are open source, and the Google SRE books are free online.
How is this list different from SRE automation tools?
This list covers the foundation tools a beginner needs. Our SRE automation tools guide covers the next layer, such as chaos engineering, runbook automation and auto-remediation.
References
What's Your Reaction?
 Like
0
 Dislike
0
 Love
0
 Funny
0
 Angry
0
 Sad
0
 Wow
0